wildman49 wrote: ↑Mon Oct 10, 2022 12:00 pm
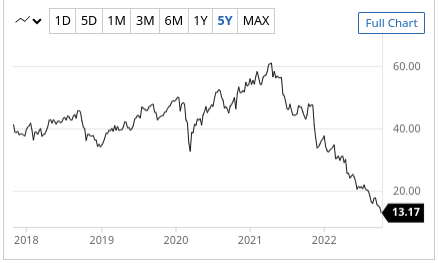
In chart 4 I think we are late 1973, with still a bigger drop coming in 2023.
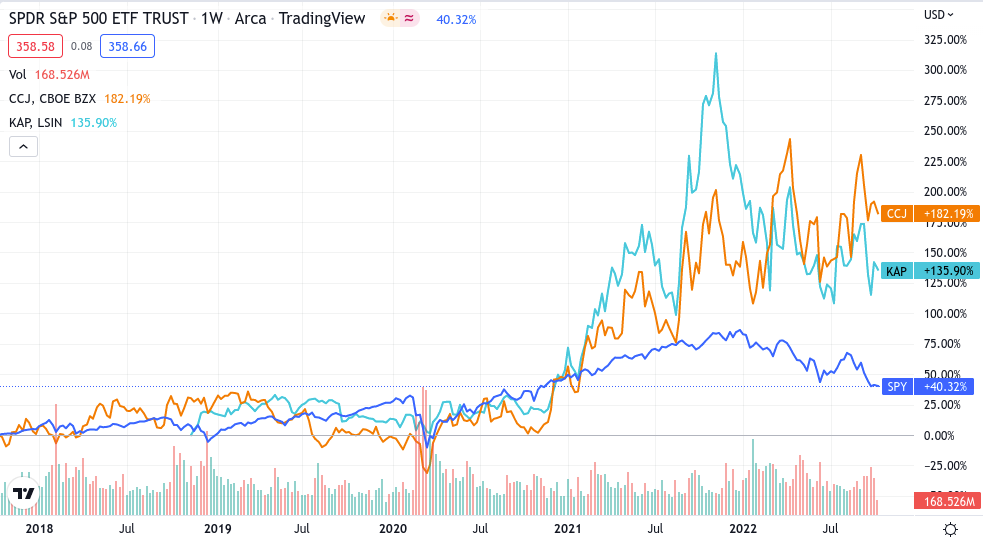
In chart 2 it took 7 and a half years to get back to high. Guys like Olds and me don't have that many years to wait it out.
(I missed the other edit window.)
But it only took 18 months to break above the point on the chart corresponding to now. And that doesn't include the 4% dividends.
There are multiple differences between that era and now. Government debt:
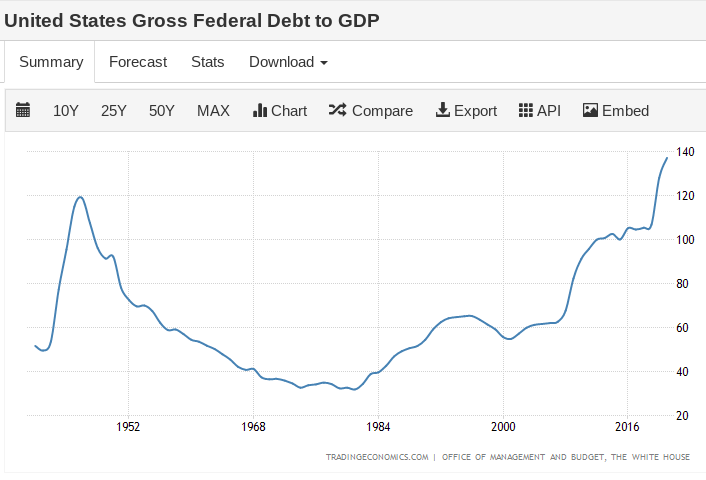
The 1970s were the low point of the modern era. Today we're at a new high, previous high being the 1940s.
The year 1974 was disrupted by the Watergate scandal which was a very big deal at the time. Any similar behavior by Biden today would be covered up by the media.
I could argue that we're more likely replaying the latter 1940s. We were coming out of massive war spending. Today we're coming out of massive flu spending.
The 1946 bear was brief but similar in magnitude to the current downturn:
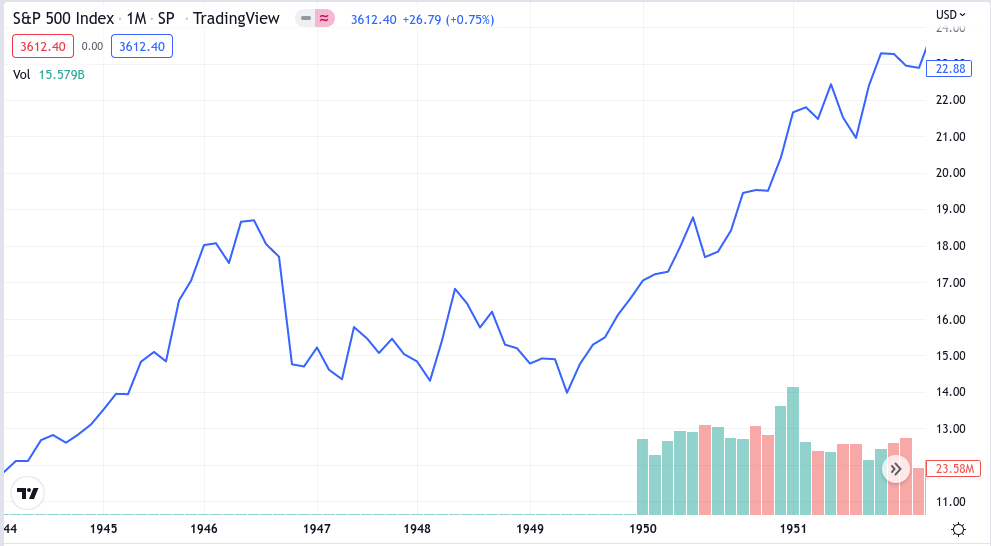
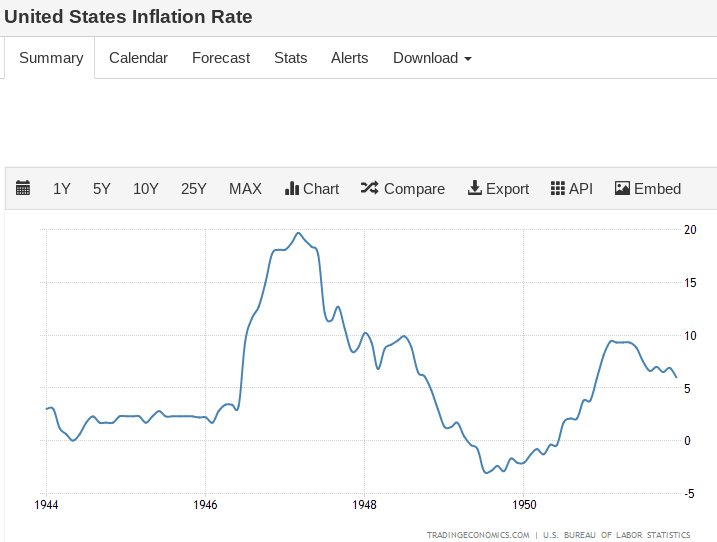
The inflation chart looked much like where we are now:
But history doesn't repeat. It only rhymes. My decisions are based on a range of probabilities.
As for not having many years to invest, I expect to reduce risk as I get older. If I feel my savings are reasonably adequate, I'll shift toward mostly hiding out in whatever looks safe. Presently I like VGSH and SCHO because 2-year yields are the highest on the entire Treasury curve.